I had a chance meeting today with a rogainer who has recently turned 75, but is still a fine athlete. He (I’ll give that much away) still has the audacity to beat me from time to time. He was asking when we are going to have an over 75 category in our rogaines. I am not sure how serious he was, but it set me to thinking about the subject.
I maintain the membership stats and I have known for some time that the average age of rogainers was increasing but I had not really done any structured analysis until now. (It was a good time to analyse rogaining data because there are a million other things I should actually be doing.) In NSW we have been fortunate to have pretty good stats since 1994 (co-incidentally the year of my first event). Thanks to Graeme Cooper for his early computerisation of rogaining.
I have pulled out the ages of partcipants at all Paddy Pallin events since 1994 and the graph looks like this.
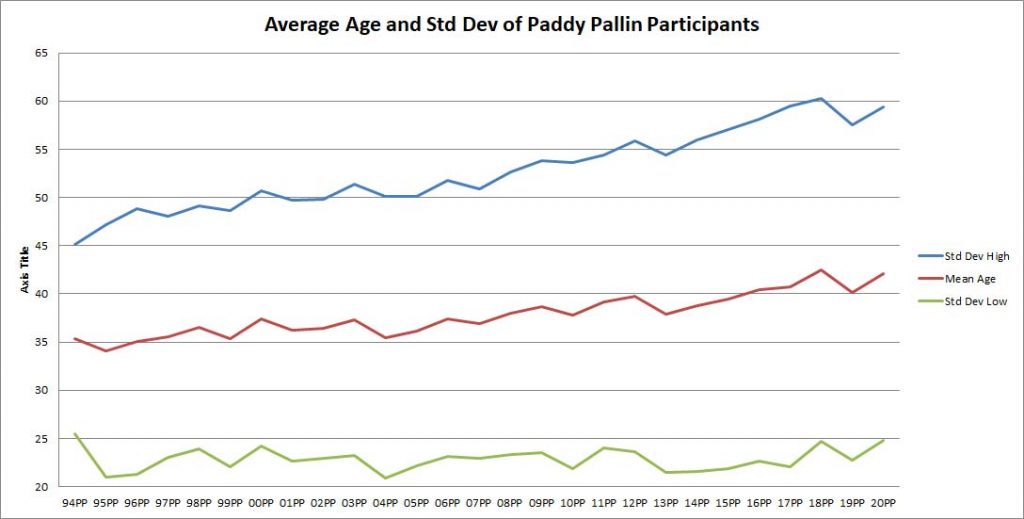
Since 1994 the average age of partipants at the Paddy Pallin rogaines has increased from 33.3 years in 1994 to 42.1 years in 2000. So in 26 years the average age of rogainers has increased by a bit under 9 years. Not only has the average age increased but the stanadard deviation of partcipant ages has also increased. In 1994 the standard deviation was 9.8 years but last year it was 17.3 years. To try an put that in human speak:
- In 1994 68.2% of all Paddy Pallin participants were between the ages of 25.5 and 45.1
- In 2020 68.2% of all rogainers were between the ages of 24.8 and 59.4
It is pleasing to see that rogaining, as a sport is capturing a broader spectrum of ages. The next question that came to mind was “Are we getting more older participants in the Paddy Pallin events?” The mean and standard deviation suggest this but “show me the numbers”.
Here is a graph of the percentage of Paddy Pallin Partcipants who are >55,>65 and >75.
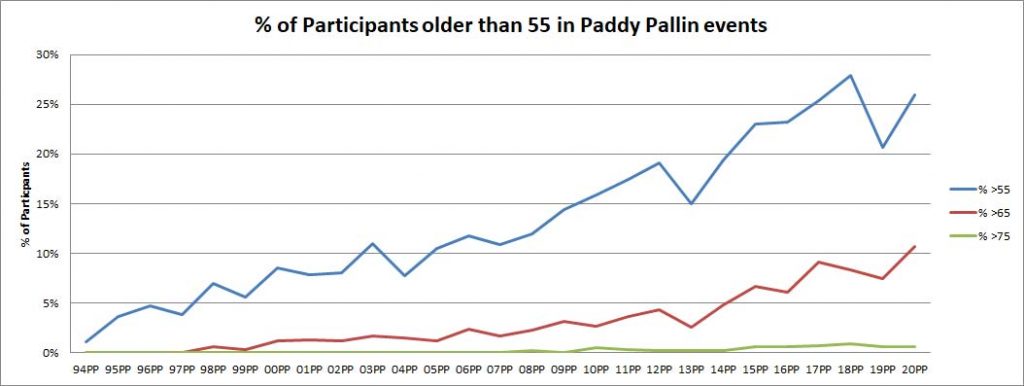
I found this graph quite interesting. In the early 90’s less than 5% of participants were over 55 years of age. Last year 26% or participants were over 55.
Having pulled out these stats the next question is why? I think there are several effects:
- Rogaining really started in NSW in 1983 or 1984. If you were a young, adventurous, 25 year old in 1983, then you were 63 in 2020. A lot of these early pioneers of rogaining are still competing today. It is interesting reading the newsletters from the early 90’s since many of the names in there are still competing today. (See the newsletter archive)
- Older partipants have time to attend more events.
- People are staying fit longer in life
Changing the subject, it is always interesting to analyse this data by sex.
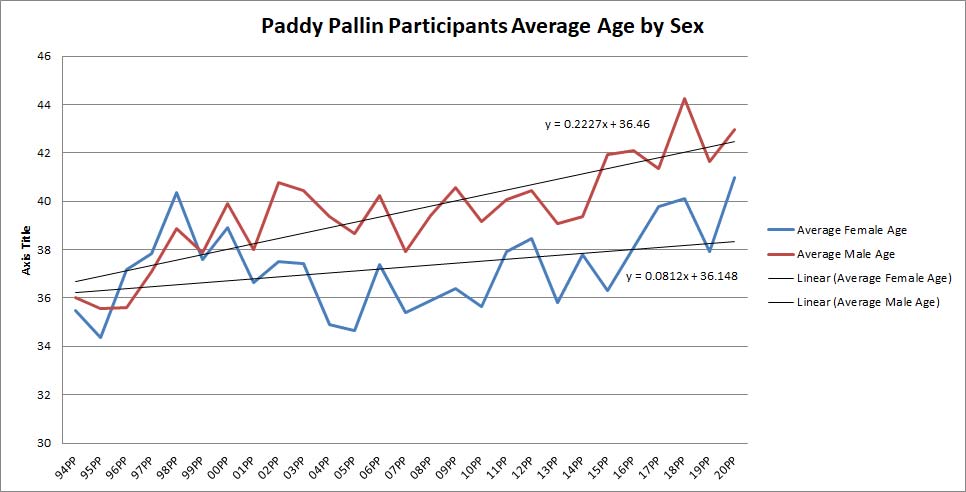
I always knew the average age of male participants was older than women by a year or so, but what it interesting is the slight divergence in the average ages of men and women over time. I would think these lines cannot continue to diverge like this.
This next graph is interesting, but off topic, and that is the % of partcipants who are female.
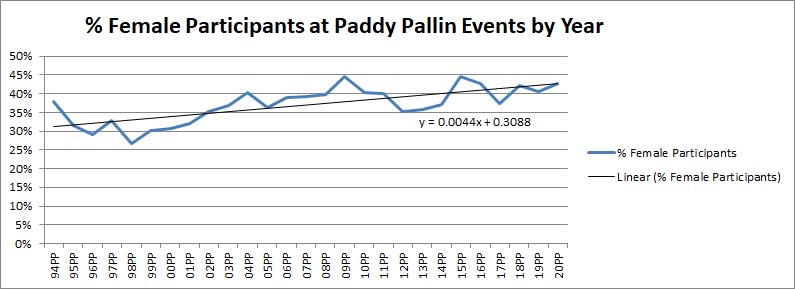
Female rogainers are definitely increasing in number and if the trendline is right male and female partcipants will be equal in number by 2038.
The other point to note, before I conclude, is that the Paddy Pallin events generally attract more participants and more younger participnts that other events, but I will save that graph for another time, when I also have heaps of work to do.
I wasn’t planning to write a thesis on rogaining statistics through the ages but let me conclude with three observations:
- Rogainers are, on average, getting older;
- There are not enough 75+ partcipants to warrant their own category at this time;
- I am not a statistician, but if you are and you’re laughing at my analysis, let me know gently.
Could you post the author’s names for this article? In fact, many of these blog posts don’t credit the authors. Can they all be credited?
Brett, I wrote this. We normally do credit the author, what has happened here is that one of the software upgrades has removed the default credit (me). So most of the uncredited articles will have been written by me. I am having a look now as to why the system generated credits have disappeared.
Thanks Chris. That is very interesting. Btw, I am a statistician and it all makes sense to me 😁. I wonder if I can find the Qld data to compare?